Poland
- Quality pass rate
- 97.0%
- Accepted / reviewed
- 291 / 300
- Cost / assignment
- $60
- Plan completion
- 98.0%
- On-time delivery
- 98.0%
- Completed assignments
- 490
Reporting · three small examples
A useful report connects the headline with the detail and gives a team a better next question.
01Reporting
Connect operating costs and revenue with completed work and the plan. A financial total makes more sense with delivery beside it.
Compare all countries with Spain. What would you investigate first?
My operational reporting covered costs, revenue, delivery volume and completion against plan. I also tracked and co-planned the company-wide P&L for the Polish entity, reconciled operational forecasts with Accounting actuals and investigated variances with Finance. Capacity planning involved Board members and the Finance Director.
Operating-cost variance: -$274. Compare completed volume with plan, then examine country costs and delivery quality before deciding where to intervene.
| Month | Revenue | Costs | Completed | Plan completion |
|---|---|---|---|---|
| August | $224,724 | $150,472 | 2246 | 97.1% |
| September | $243,229 | $162,864 | 2431 | 97.2% |
| October | $264,380 | $177,026 | 2642 | 97.1% |
| Country | Completed | Planned | Revenue | Costs |
|---|---|---|---|---|
| Poland | 490 | 500 | $49,000 | $29,400 |
| Germany | 412 | 420 | $45,320 | $29,664 |
| Spain | 341 | 380 | $30,690 | $27,962 |
| United States | 592 | 600 | $71,040 | $47,360 |
| India | 511 | 520 | $35,770 | $20,440 |
| Australia | 296 | 300 | $32,560 | $22,200 |
Plan completion = completed / planned. Cost per assignment = operating costs / completed. Revenue − operating costs is this example’s operational contribution, not a complete company P&L.
02Reporting
Bring the important signals together so a team can see what deserves attention and decide what to do next.
Choose a region. Does the overall picture tell the whole story?
I delivered operational reporting, secured Apache Superset adoption, and coached colleagues on reporting quality, data interpretation and ROI. My experience also includes Power BI and Superset with Redshift and Athena.
Read the full storyCoverage is below the illustrative 95% threshold. Cost per assignment is elevated and local capacity is below demand.
Investigate demand and local capacity before changing the allocation plan. A cheaper assignment is not useful if it cannot be covered.
| Region | Planned | Covered | On time | Cost ($) | Capacity |
|---|---|---|---|---|---|
| North | 540 | 534 | 529 | 24,564 | 620 |
| East | 480 | 466 | 454 | 27,028 | 495 |
| South | 520 | 471 | 443 | 39,093 | 485 |
| West | 640 | 630 | 621 | 30,240 | 710 |
Coverage = covered / planned. On-time = on-time / covered. Capacity is expressed in assignments.
03Reporting
An overall average can hide very different local conditions. Compare quality, assignment cost and delivery by country.
Select up to three countries. Does a lower assignment cost tell the whole story?
I built and used reporting on freelancer quality, assignment costs, delivery, coverage and capacity across a distributed operation. These views supported decisions by operational teams and senior stakeholders. I also coached colleagues on reporting quality, interpretation and using data to decide what to do next.
Select up to three countries to compare.
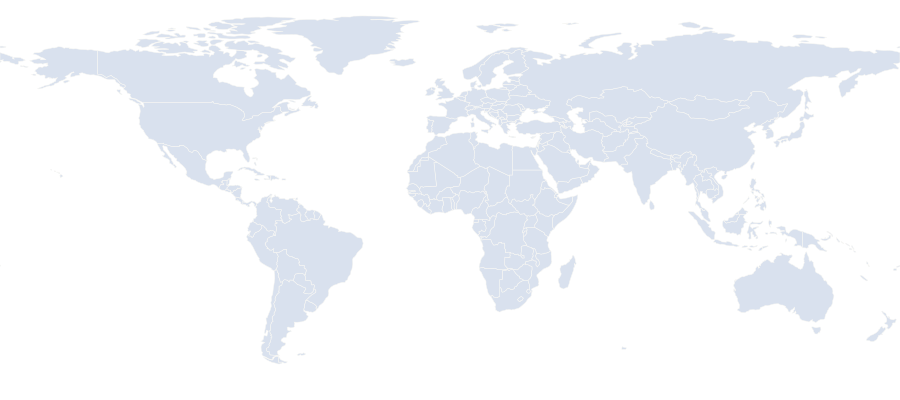
Quality pass rate = assignments accepted without correction / reviewed assignments. On-time delivery is measured separately. Combined rates use the underlying counts, rather than averaging country percentages.